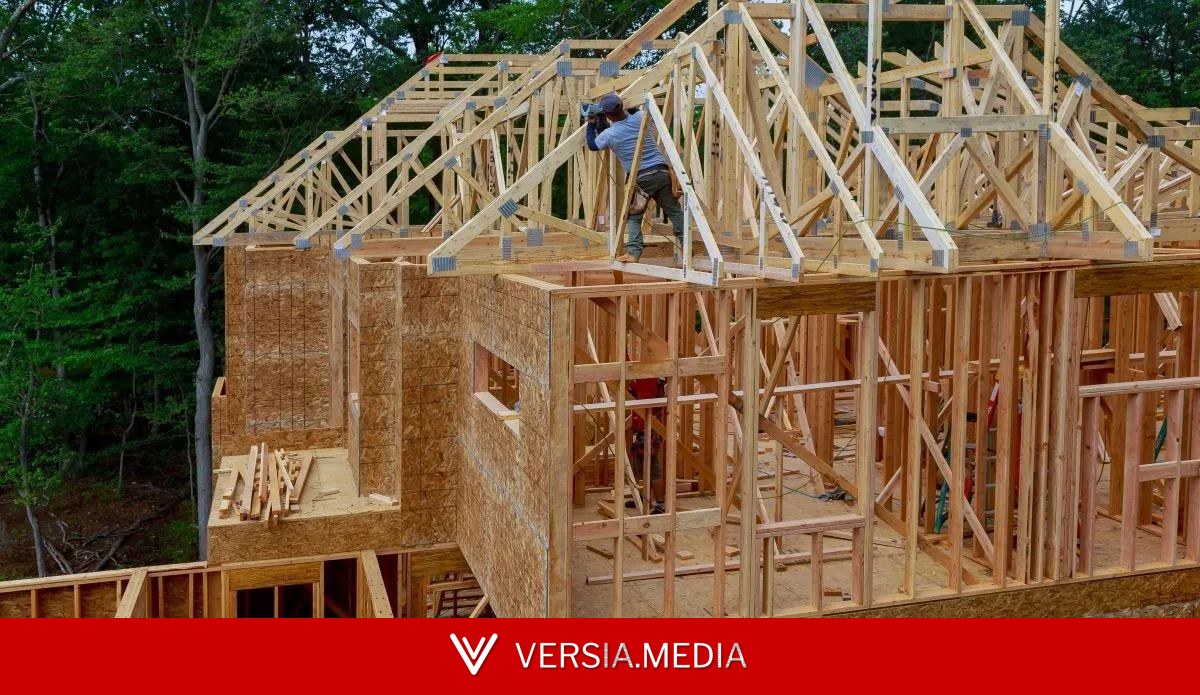
Builders have managed demand with incentives, but new home sales remain range bound and fell in May 2026. With completed homes for sale still elevated, the report points to demand, not capacity, as the binding constraint on construction growth. AI Summary
New home sales tanked this morning and had a slightly lower negative revision. But the bigger story is that demand is the main reason housing construction hasn’t been growing for years, and we simply have too much completed supply for sale for construction growth to ramp up. Let’s remember this lesson as we are on the verge of seeing the ROAD to Housing Act signed into law : builders need more demand to get housing construction going.
Let’s take a look at the report today.
From Census : New Home Sales: Sales of new single-family houses in May 2026 were at a seasonally-adjusted annual rate of 580,000, according to estimates released jointly today by the U.S. Census Bureau and the Department of Housing and Urban Development. This is 7.3 percent (±13.3 percent)* below the April 2026 rate of 626,000, and is 6.8 percent (±12.8 percent)* below the May 2025 rate of 622,000.
The new home sales sector hasn’t really gone anywhere for years. We get a few positive reports that grow sales for a few months and then a few that take sales lower but when you look at the chart of new home sales over the past 10 years, we have basically been stuck in a sales channel range for a long time. The builders have done their best to sell homes using their profit margins to buy down mortgage rates . Imagine if they didn’t have that option — sales and housing construction would be worse today.
Now, if new home sales start to tank more from this level, then my key economic labor data, residential construction labor, will take a bigger hit, and when we look at previous economic cycles, it’s never a good thing when this labor pool starts to fall.
So, given the demand data above, it’s not surprising that the chart below shows a negative trend in housing permits and starts for years now.
One slightly positive note
My theme forever has been that the builders aren’t the March of Dimes so they need to make money and make sure supply doesn’t surge on them. Historically, they really pull back on building if completed units for sale exceed 120,000. Here is the January of every year going back decades, which illustrates this point.
Now, in this report, we see a bit of progress here — the completed units for sale is not growing anymore but slowly moving lower. If we can get new home sales growing again, then we can get the chart below falling and more housing permits will be issued.
This report shows more of the same when it comes to new home sales, but the fact that completed units for sale aren’t growing is a positive sign that if mortgage rates can just get low enough to create more consistent demand, then we can build more homes again. The best way to deal with inflation in the long term is always supply; demand destruction is a short-term tool, not a good long-term one.
Leave a Reply Cancel reply
Your email address will not be published. Required fields are marked *
Comment *
Email *
Save my name, email, and website in this browser for the next time I comment.
Pending sales rose to 75,856 vs 72,039 in 2025 as inventory turned negative year over year with mortgage rates near 6.58%.
HUD tests a new Operation Breakthrough for today’s housing crisis Jun 23, 2026
SERHANT. expands into Texas with 13 founding agents Jun 23, 2026
Keys to the housing market for the rest of 2026 Jun 20, 2026
Fannie Mae to expand title pilot program, Pulte says Jun 24, 2026
Congress passes 21st Century ROAD to Housing Act, sends bill to Trump Jun 23, 2026
A Pennsylvania broker sued state regulators, arguing the in-state main office mandate is unconstitutional and costs him about $35,000 a year.
Select a zip code to view market data, or leave blank to see national trends.